Dashboard
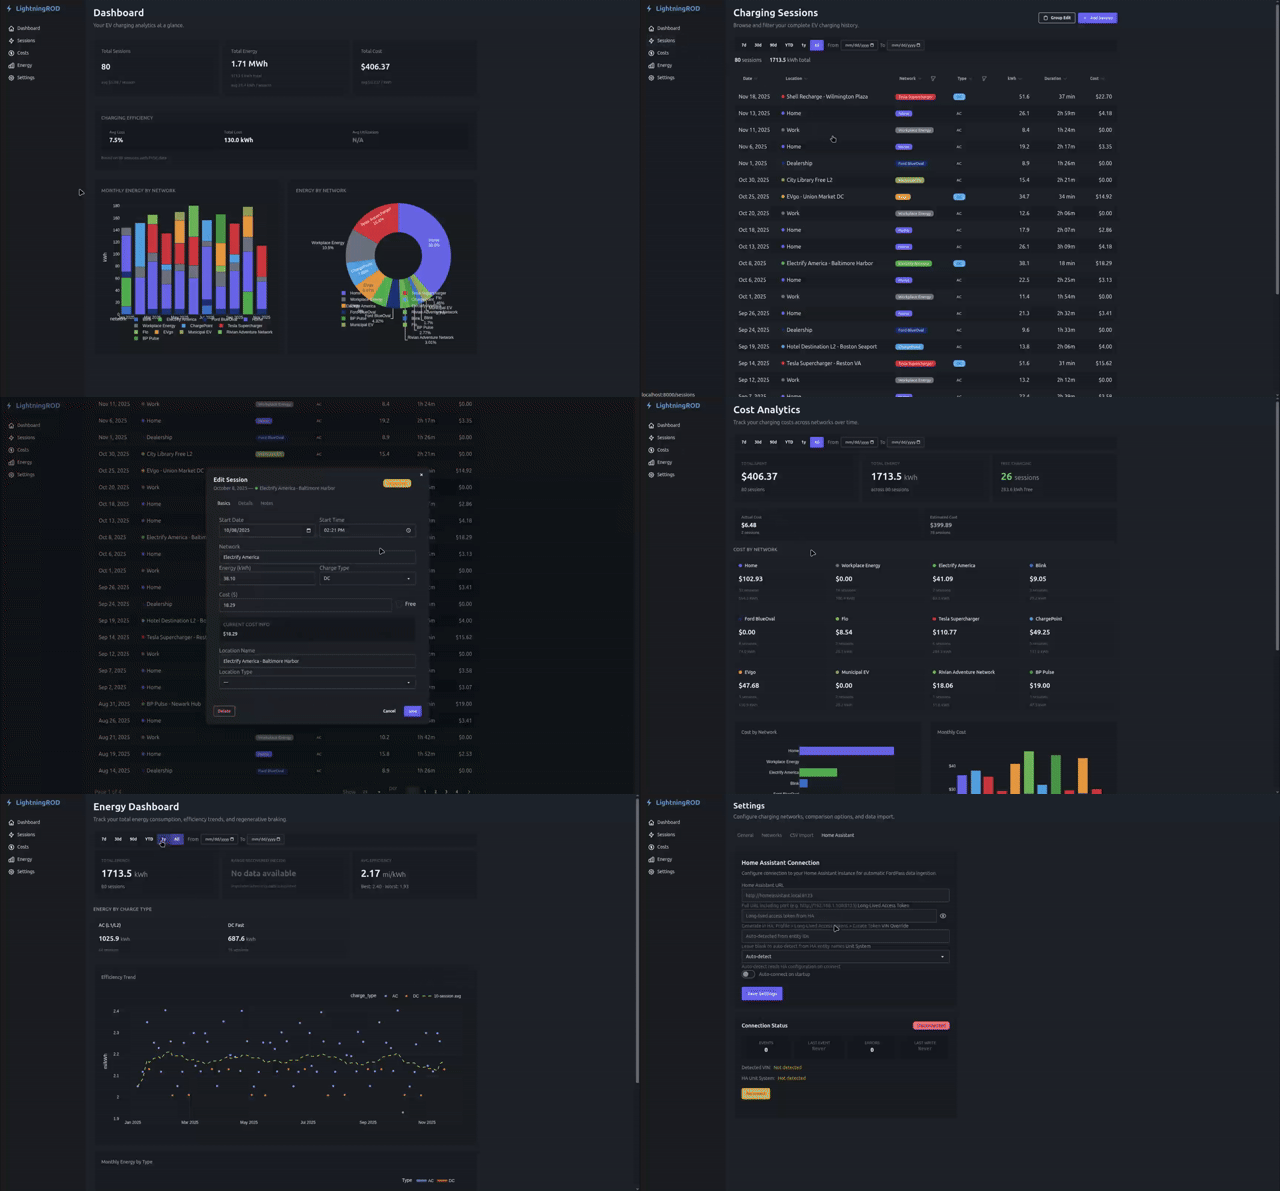
The dashboard (/) gives you a quick overview across all vehicles.
Vehicle Cards
The top section shows your configured vehicles, session counts, and last-charge dates. One vehicle can be marked active for vehicle-specific pages, but dashboard totals stay global.
Summary Cards
Three cards at the top:
| Card | Shows | Detail |
|---|---|---|
| Total Sessions | Lifetime session count | Average cost per session |
| Total Energy | Lifetime kWh (switches to MWh above 1,000) | Average kWh per session |
| Total Cost | Lifetime charging cost | Average cost per kWh |
Charging Efficiency
The efficiency card shows aggregate metrics, each fed by different session data:
- Avg Loss -- Average percentage of energy lost between charger delivery and vehicle receipt. Needs wall-metered EVSE energy on the session.
- Total Loss -- Cumulative kWh lost across sessions with metered EVSE energy
- Avg Utilization -- Average percentage of charger rated capacity actually used. Needs only a rated charger power (e.g. from an EVSE stall mapping).
Loss and utilization are independent: mapping a session to an EVSE stall enables utilization right away, while loss stays N/A until sessions carry wall-metered energy. The caption under the card says how many sessions feed each metric.
Charts
Two charts in a side-by-side grid:
- Monthly Energy by Network -- Stacked monthly energy totals grouped by charging network
- Energy by Network -- Donut breakdown of total delivered energy by charging network
Both network charts show your top 7 networks individually; anything beyond that folds into a gray Other bucket to keep the charts readable.
Charts are interactive with hover details and zoom controls.
Empty State
If no sessions exist, the dashboard shows a prompt to import data through Settings.